Project 2
For Project 2, I chose to create and explore a dataset to evaluate if my walking patterns changed during the government shutdown. I work in a research lab that is supported by federal grants, so I worked reduced hours during the shutdown. I’m curious to see if this unexpected shift in my daily routine led me to walk more, less, or about the same compared to the weeks and months before.
To assess these changes, I collected daily data from September 15 through October 30, 2024, as a comparison period, and from the same dates in 2025, which covered the weeks before and during the shutdown. The earlier period helped me account for potential seasonal effects such as cooler temperatures or shorter days in October that could influence walking patterns independently of the shutdown itself.
My dataset includes the following variables: Date, Day, Month, Year, Workday (Y/N), Shutdown(Y/N), Steps, High (°F), Low (°F), and Precipitation (Y/N). Step data were drawn from my iPhone’s built-in Health app, which automatically records daily step counts. Weather data were sourced from the website world-weather.info. I included these additional variables to explore whether any observed differences in my walking patterns were due to the shutdown itself, or simply reflected normal variation in work schedule or weather conditions.
Statistical Analysis
Before exploring the visual patterns, I ran a few basic statistical tests to see whether the shutdown was associated with differences in my daily step counts. A Welch two-sample t-test comparing shutdown days to non-shutdown days suggested a borderline difference in step count (p = 0.056): on average, I walked about 7,883 steps during the shutdown compared to 4,941 steps on non-shutdown days.
To account for other factors that might influence my step count, I also fit a simple regression model that considered shutdown status, whether or not it was a workday, the daily high temperature, and whether or not it rained. The model suggested that I did tend to walk more on shutdown days, but the difference was not significant, meaning it may be attributable to normal day-to-day variation.
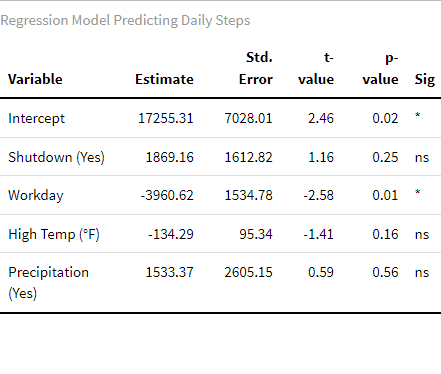
The clearest pattern in the model was about my routine: I consistently walked fewer steps on workdays than non-workdays. Temperature and rain didn’t appear to make much of a difference, though it is worth noting that there were not many days with rain in the dataset.
Overall, the model results point toward two themes that I explore more fully in the visualizations: (1) steps do appear higher during the shutdown period, but the effect is mixed once weather and work schedules are considered, and (2) weekday patterns play an important role in how much I walk on any given day.
Median Steps
This visualization compares my median daily steps in September and October across 2024 and 2025. The difference between median step count in September 2024 and September 2025 is not statistically meaningful, however it is worth noting that the observation period began on 9/15, so the smaller number of days in the dataset likely contributed to the lack of significance.
October shows a clearer pattern: in 2025 during the government shutdown, my median steps were significantly higher than in October 2024. This difference suggests that the change in my routine during the shutdown may have encouraged more walking, and that this effect becomes more visible when looking at a full month of data.
Median Steps, Weekdays Only
When I limit the data to weekdays only, the year-to-year differences in median steps mostly disappear. Neither September nor October shows a statistically meaningful change once weekends are removed. This finding supports the model’s conclusion that workdays consistently bring down my overall step counts and suggests that the higher October 2025 median in the previous graph was influenced in part by weekend activity rather than weekday walking alone.
Daily Trends
Since the earlier visualizations suggested that weekends and a few unusually active days might be influencing the overall results, I broke the data out by individual days to see the variation more directly. This daily view makes the outliers in 2025 easy to spot. In particular, a spike during a music festival in late September and another jump during a mid-October trip to an out-of-town wedding. These atypical days pushed the averages upward, showing how a small number of high-activity events can shape the broader patterns in a relatively small dataset.
Days of the Week
Looking at median steps by day of the week, the first half of the week (Sunday through Wednesday) is fairly similar across 2024 and 2025. The real differences show up from Thursday through Saturday, where 2025 is consistently higher. This increase lines up with how my schedule changed during the shutdown: with reduced hours, I had more flexibility for long weekend trips and other activities that naturally led to higher step counts. So the increase I’m seeing is not sue to a change in to my day-to-day routine, rather from having more time to do things outside of my normal routine.
Conclusion
Overall, my data suggests that I did walk more during the government shutdown, but not in the straightforward “more steps every day” way I initially expected. The increase came mostly from the tail end of the week where I had more time for longer outings, weekend trips, and other activities I wouldn’t usually fit in while working full-time hours. My weekday walking stayed relatively consistent across both years, which reinforces that my day-to-day routine didn’t change as much as the extra free time around it.
There were a few limitations to this project. Because I only collected data for the second half of September, the smaller sample size made it harder to detect meaningful differences in that month. My dataset also relied on step data from my phone, which is not perfectly accurate and can miss steps when I am not carrying my phone, as I often am not when I walk around my apartment, at the gym, or on walks around my neighborhood. Additionally, since most of the variation in my dataset came from one-off events like a music festival and a vacation, my results reflect a mix of typical days and unusually active ones. Another limitation is that I didn’t include other variables, like commute distance, class days, or time spent at home, which might have helped explain some of the daily fluctuations.
If I were to expand this project, I would collect a longer time series and track additional context, like how long I was outside, or whether I intentionally exercised on certain days. It might also be interesting to compare this shutdown period to other times when my schedule changed, like holidays or travel, to see whether the pattern repeats. Even with its limitations, this project showed me how much my walking is shaped not just by daily habits but by the pockets of free time around them.
Visualizations also available on Tableau Public
Hello world!
Welcome to CUNY Academic Commons. This is your first post. Edit or delete it, then start blogging!